Google began including page speed as one of its ranking factors in 2018 due to the importance of page speed to user experience.
According to a Google page speed benchmark report, if the load time increases from one second to seven seconds, there is a 113% greater chance that a mobile site visitor will leave the page. Therefore, whether developing a website for desktop or mobile use, load speed is critical to Search Engine Optimisation (SEO).
Google claims that the speed and bounce rate of your website are inversely related. As the load time grows, the likelihood that users will leave your website even before it loads rises significantly.
Google advises web developers and site owners to prioritize user-centric performance metrics for the web pages in order to prevent that. It places a strong emphasis on using resources to assess web page performance and implement features that will improve user experience, such as Google’s PageSpeed Insights and Google Lighthouse.
This post explains how to maximize page conversion with Google PageSpeed Insights’ features and how to take the speed test.
How Do Conversions Affect PageSpeed?
Google reports that if a mobile page takes longer than three seconds to load, fifty-three percent of visitors will leave. Page speed, according to Google, is two things:
-
-
- The amount of time needed for above-the-fold content to fully display
- The duration of time required by a browser to fully render a page
-
However, there are a number of reasons why a page might take longer to load than expected, including poor mobile user networks, cellular data, cache buildup, web hosting services for a domain, etc.
Although there are many uncontrollable factors that affect page speed, the owner of the website can still optimize certain aspects, like excessive JavaScript, videos, content, etc.
When displaying a website for SERPs, Google takes into account its overall performance SERP (Search Engine Results Pages). This covers all elements—including page speed—that have an impact on the user’s experience. Page speed is therefore a crucial SEO element that demonstrates your commitment to producing a top-notch user experience.
When a website is properly optimized, it can have a remarkable conversion rate that includes a fast load time.
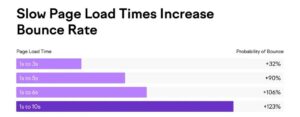
According to Google’s research, there is a 32% increase in the bounce rate when the load time increases from one to three seconds. The bounce rate rises to 90% if the page loads in five seconds or more, and it even surpasses 120% if it takes ten seconds or longer.
PageSpeed Research by Google
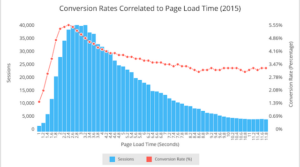
The relationship between load time and conversion rate is explained by a Google study. According to the study, it takes an average of 22 seconds for a mobile landing page to load.
It takes nearly seven times as long as the average visitor can tolerate, which is why 53% of users leave the page before it even loads. A lagging landing page causes a website to lose more than half of its prospects.
Additionally, researchers have discovered a correlation between conversion rate, website load times, and page weight (based on data size) thanks to SOASTA’s machine-learning technology. The likelihood of conversion decreases by 95% if a page has 6000 elements instead of the minimum 400, including text, images, and other elements.
In simple terms, a heavier page causes poorer conversion and slower loading times.
It is not always easy to determine the cause of a page’s slow loading speed. While the excessive amount of text and images is clearly visible, some problems, such as excessive CSS and JavaScript scripts and other redirects, are more difficult to identify.
Fortunately, you can find out why load times increase by using tools like Google PageSpeed Insights.
Google’s PageSpeed Insights (PSI) Explains
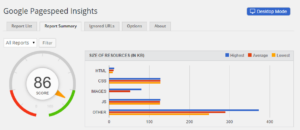
Google PageSpeed Insights is an automated tool for performance analysis that assesses the content of web pages for both desktop and mobile versions of websites.
This speed test calculates the loading time, returns a page speed score, and suggests possible optimizations. PSI provides a thorough score that explains how Google evaluates a website’s technical performance.
Pro Tip: Keep in mind that Google only takes into account site speed when determining rankings; the Google PageSpeed Insights score is not taken into account. The score is merely a broad approximation of the page’s functionality.
PSI generates a combined score for a webpage by combining lab and field data. While field data is useful for gathering real-world information, its metrics are constrained. Although gathering lab data in a controlled setting is beneficial for debugging, it is unable to identify real, tangible bottlenecks.
The CrUX algorithm assigns scores for various real user experiences in a range of 0 to 100. Different metrics record the time and speed of loading other components.
Common names for these metrics include LCP, FID, FCP, and CLS. It is predicated on the total information gathered during the preceding 28 days.
Experiences for experimental measures computed under lab data are also included in the scores. Experiences include Speed Index, Time to First Byte, or TTFB, and Interaction to Next Paint, or INP.
The combined result displayed by Google PageSpeed Insights includes lab data obtained by Google Lighthouse and field data received by Chrome User Experience Report (CrUX). By navigating between the corresponding tabs, you may see the desktop and mobile versions.
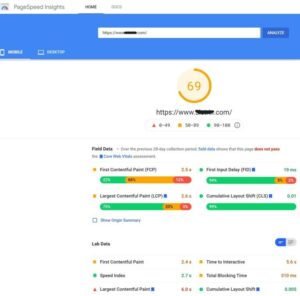
Field Data Scoring
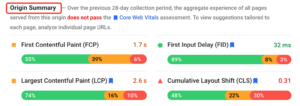
Field Data is displayed first in the PSI result following thorough processing. The information pertaining to the FCP, FID, LCP, and CLS experience of the user is found in the Chrome User Experience Report or CrUX. The various factors are computed in the following manner:
-
-
- The FCP measures how long it takes for the first image or text to load in the browser. This number indicates how long it takes a user to engage with the website for the first time, approximately.
- The FID value evaluates how quickly a user interacts with a page and how responsive it is. The time elapsed between the user’s initial click or interaction with the page and the browser’s real response to that action is known as the first input delay value.
- The LCP calculates how long it takes a browser to render the page’s most important part. It usually serves as the primary material of the page and permits people to utilize the actual information thereafter.
- The CLS is used by Google to calculate the amount that the content “jumps” when the page loads. This frequently occurs when ads take longer to load or when graphics are refreshed. When the arrangement remains constant and does not change, it is simpler for the user to take in the information. This kind of layout shift is called cumulative.
-
The values in this result are shown according to speed, separated into three distinct colour categories:
-
-
- Fast is displayed in green. It is where the FCP lies between 0 and 1 second, FID between 0 and 0.1 seconds, LCP between 0 and 2.5 seconds, and CLS change ranges between 0 and 10 %.
- The average performance is displayed in orange. It is when FCP lies between 1 and 3 seconds, FID is between 0.1 and 0.3 seconds, LCP is between 2.5 and 4 seconds, and CLS change ranges between 10 and 25 %.
- Slow is displayed in red. Here, FCP is more than 3 seconds, FID is more than 0.3 seconds, LCP exceeds 4 seconds, and CLS change is more than 25 %.
-
The page displays a sub-item called “Show Origin Summary” after the field data score. When you click this, the information provided above will be shown at the domain level instead of the URL level.
However, Google will indicate in a remark the “Origin Summary” data if there is insufficient data in the CrUX data set for a specific URL.
Core Web Vitals
A common set of metrics called Core Web Vitals assesses URL performance and user experience based on a number of criteria. It is tracked for desktop and mobile devices to obtain insight into the user experience and act as a ranking factor for Google.
For each page, the three essential metrics under Core Web Vitals are LCP, FID, and CLS.
If all three indicators are 75% green with enough data, the aggregation passes the Core Web Vitals exam; if not, it fails the assessment. The other two must score 75% green to pass the evaluation in the event that the data is not sufficient for FID. On the other hand, if there is insufficient LCP or CLS data, the page aggregate is not evaluated.
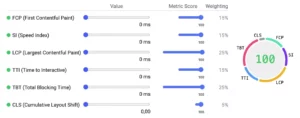
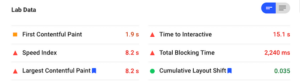
Lab Data Scoring
Lighthouse API is the technology used by Google PageSpeed Insights’ Lab for data analysis. Values from lab tests are derived from the website’s performance in relation to general performance best practises. Additionally, Google Lighthouse assesses and rates the FCP, LCP, and CLS experiences of users.
The Speed Index, Time to Interactive, or TTI, and Total Time to Block, or TBT, are also assessed using lab data.
-
-
- The speed index measures how long it takes for the page’s content to load graphically.
- Time to Interactive or TTI is the amount of time it takes for a page to load entirely interactively.
- Total Time to Block or TBT stands for the total time between full-page interactive elements and the front end.
-
Additionally, based on their performance, this tool categorizes different lab data metrics as Fast, Average, and Slow. Even when computing FCP, LCP, and CLS in both analyses, the threshold differs for every test.
- Green indicates that it is fast. In this, FCP lies between 0 and 2 seconds, Speed Index is between 0 and 4.3 seconds, LCP is between 0 and 2 seconds, TTI is between 0 and 3.8 seconds, and TBT is between 0 and 0.3 seconds. CLS change is between 0 and 10 %.
- Orange indicates the average. Here FCP is between 2 and 4 seconds, Speed Index lies between 4.4 and 5.8 seconds, LCP is between 2 and 4 seconds, TTI is between 3.9 and 7.3 seconds, and TBT is between 0.3 and 0.6 seconds. CLS change is between 10 and 25 %.
- Red indicates slowness. Here FCP is more than 4 seconds, Speed Index exceeds 5.8 seconds, LCP exceeds 4 seconds, TTI exceeds 7.3 seconds, and TBT exceeds 0.6 seconds. CLS change is more than 25 %.
Sometimes the lab data differs from the field data, as you may have noticed. This is because field data comes from real user experience, while lab data comes from a simulated environment with predetermined network conditions.
As a result, the values in the two categories vary depending on the specifics of each event.
Pro Tip: There’s no guarantee that the real user experience will be positive even with strong lab evidence.
Opportunities
Following its analysis of the website’s performance, Google PageSpeed Insights displays the opportunities and diagnostics area. Here, the program offers specific suggestions or possible optimization pointers that shorten loading times and increase website speed.
It also shows how much time can be saved by following the tool’s recommendations.
By selecting the drop-down arrow next to the identified Opportunity in the report, you may examine even more details. It provides a thorough explanation of the problem and suggests solutions.
Diagnostics
Similarly, based on its examination of the webpage, the Diagnostics section provides information about the best practices that the webpage does not follow. Here, the drop-down arrow provides you with additional specific information about the issue and recommended practices.
Pro Tip: The information in the diagnostics section review has no direct bearing on the PageSpeed Insights scores. It only offers comprehensive details on possible problems and the most appropriate fix.

Passed Audits
Google Lighthouse’s report includes a list of the page’s strong points after a comprehensive analysis. This enables the proprietor of the website to comprehend whether regions are compliant with PageSpeed Insights guidelines.
It is beneficial to see if your page analysis yields a lengthy list of audits that pass. It provides the optimal page speed practices and indicates that your page passed the speed test.
How to Score High on the PageSpeed Insights Tool?
Some find the complexities of the PSI score to be intimidating. Still, Google cares about its consumers all the time and provides thorough recommendations for an improved experience. A free tool from Google called PageSPeed Insights alerts users to various load time concerns in the Opportunities area and offers action items to help fix the issues.
In addition to those recommendations, website owners may want to think about the following techniques to reduce loading times and achieve the highest PageSpeed Insights score. These would not only increase the speed of the pages but also contribute to the general attractiveness and performance of the website, making it one of the most advanced web applications.
Avoid Post-Click Landing Page Redirects
Post-click landing page redirection is the process of sending a user to a different page after they click on an advertisement, link, etc. It usually happens when the owner of the website moves or deletes a page.
Google claims that a few popular redirect patterns can affect a website’s overall speed and user experience. Every redirect affects the rendering of the website overall, lengthening the time it takes for pages to load. Redirecting less traffic is therefore necessary to boost overall performance.
Often, redirects lead to device-specifically optimized web pages. You can avoid frequent redirects by designing your website with a responsive layout that works well on all devices.
Minify JavaScript and CSS files
Minifying is the process of removing or fixing redundant and unnecessary data without altering the way the browser renders the page. This involves downsizing the CSS, HTML, or JavaScript files and getting rid of unnecessary spaces and characters.
To minify different browsers, you can utilize different plugins. Try the HTML minifier, CSSNano, WP Rocket, and Closure Compiler plugins for HTML, CSS, JavaScript, and WordPress, according to Google. Consequently, this reduces the file size and enhances page performance.
Enable Compression
Comparably, eliminating unnecessary data through compression lowers the page load by over 90%. In this manner, users are provided with a quicker-loading, smaller version of the compressed page by the browser. This would improve your PageSpeed Insights performance automatically.
The best method for drastically reducing page size is to use a compressor or compression algorithm. To aid in compression, you can employ formats such as WEBP and minimize the size of your images. Enabling text compression recommendations is another way to reduce superfluous content on the page.
Prioritise Above-the-fold Content
The viewer can view the text above the fold without having to scroll the screen. In order to save consumers time viewing the material, this page needs to load more quickly. Making this a priority is therefore essential to enhancing site performance.
To immediately draw users’ attention to the most important stuff on your page, important content must be placed first. Additionally, you may quickly convey the main idea of your website and increase your ranking on Google PageSpeed Insights by doing this.
Use Browser Caching
With browser caching, you can prevent the need for a page reload every time a user visits by keeping previously loaded data in memory. This covers the logos, footers, and so forth. These resources improve page load speed by not needing to reload each time a visitor views a new page on your website.
You can use different plugins to enable browser caching. For those websites, for instance, you can utilize the WP plugin W3 Total Cache. More than one million people have installed one of the most widely used caching plugins. The plugin promises to improve PageSpeed Insights score and increase site performance by a minimum of ten times.
Minimise Request Counts and Transfer Size
If the number of queries your browser has to make to load the pages and the resources your server delivers is large, it increases load times. Google advises you to reduce both of these factors.
Google advises customizing the quantity and size of requests by creating a performance budget, even if there is no perfect amount or size. It would depend on how many external resources you need, how big your scripts and frameworks are, how many web fonts you use, etc.
Serve Images in Next-Gen Formats
Google produced photographs in next-generation formats, including JPEG 2000, WebP, and JPEG XR. When compared to older formats, these exhibit superior qualities and compression standards. Additionally, they load more quickly than popular picture file formats like JPEG and PNG.
WebP images are becoming more and more common, eventually replacing other image formats. A feature of many plugins, such as Smush and Imagify, is WebP conversion. This is due to the fact that WebP files are roughly 25–30% smaller than JPEG files without sacrificing quality. Furthermore, it reduces the page weight by 25%, which results in a 3% reduction in loading times.
Steer Clear of Lengthy Embedded Video Content
Refrain from adding lengthy videos that showcase your goods and services to your website. Videos consume a lot of bandwidth and strain the web server when several people watch them at once.
Alternatively, you can save videos on another platform, like YouTube, and embed them into the page’s media library. This would greatly speed up your website’s loading speed.
Speed Up Response Times for Servers
The server response timings show how long it takes for your server to start loading the page content for the user. There are several factors that can reduce server response times, such as memory leaks, slow routing, frameworks, database queries, libraries, etc.
Your web hosting platform has a huge influence on your server’s speed. Invest in a reliable web host, like Server Gigabit, to have a lightning-fast website that functions effectively under load.
Remove the Render Blocking Resource
The render-blocking resources that are essential to page rendering are static files such as HTML, CSS, and JavaScript. To view the complete page, users must download these files. By forming a bottleneck, many of these static files in the area above the fold slow down the pace of the website.
There are two ways that render-blocking resources can be eliminated.
Inlining: The term “inlining” describes the use of a plugin to insert JavaScript or CSS into an HTML file. For WordPress websites, Autoptimise, for instance, inclines the code. However, this process is only applicable in small areas.
Defer and Async: Large websites can avoid render-blocking by utilizing this technique. While the defer attribute delays the scripts’ execution until after the HTML parsing is complete, the async attribute initiates the scripts immediately upon download.
Minimise Main Thread Work
A web page’s main thread is an essential component. It modifies the website’s code to create a user-friendly webpage. The main thread performs two important tasks: it handles user interactions and parses HTML, JavaScript, and CSS files.
The main thread is unable to finish both tasks at once. It therefore does not process user requests even when it is working on the site code. If the main thread takes longer than the typical 4 seconds, this causes the speed at which pages load to slow down.
Use Video Format for Animated Content
To add visual appeal to their web pages, some website owners opt to use GIFs. Feature reviews, instructional videos, and humorous animations all work well to improve page views and increase user satisfaction.
However, these striking GIFs detract from the page’s performance. They load slowly and use a lot of data. As a result, Google PageSpeed Insights suggests switching to video content. Using the command line interface, GIFs can be converted into video file types. Use programs like FFmpeg, which enable command-line interface video file conversion, to accomplish that.
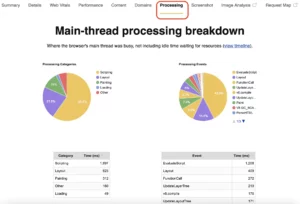
Here are some methods for reducing work on the main thread:
-
-
- Reduce the size of JavaScript, CSS, and HTML files by minifying them via deferring or inlining.
- Using programs like ChromeDevTools, locate any extraneous CSS and JavaScript codes, then eliminate them by deferring attributes and inlining them.
- Implement code splitting using Webpack to split JavaScript into different bundles. This advanced technique removes the need to load all codes to make the webpage interactive.
- Using browser caching to prevent users from having to refresh every time they visit a new page.
-
Preload Key Requests
By using this tip, you can reduce the number of queries that browsers have to make to the website’s server. It’s similar to Google’s suggestion to “Preconnect to required origins” aside from not connecting to outside resources. Conversely, preload key requests require loading necessary resources onto one’s own server.
To use this method, you need to make a change to your WordPress theme file. The header.php file is where you can add any recommended link tags from Google PageSpeed Insights. Additionally, you can add these link tags by using other plugins, such as WP Rocket and Perfmatters.
Make Sure Text Is Visible While Webfont Loads
Usually, people are concerned about large photos and movies. When analyzing the elements that contribute to a web page loading slowly, most people overlook fonts—the large, hidden files. Sometimes, browsers will hide text until your favorite font has completely loaded. As a result, you have to wait longer for the page to render.
Google PageSpeed Insights advises using Font Display API for this reason in order to keep the text visible to users while the web fonts load.
Implement AMP
This function is exclusive to users of mobile devices. Accelerated Mobile Pages is what AMP stands for. Google made this change to speed up the loading of numerous pages and mobile websites. The program generates an open-source format that eliminates and filters a ton of superfluous content.
As a result, the mobile page loads more quickly. Additionally, it simplifies the experience for mobile users by eliminating cumbersome elements that don’t work well on mobile devices. AMP frequently appears in a variety of Google search results. Because AMP-based articles include less formatting, they load more quickly and provide the user with content more quickly.
Avoid Chaining Critical Requests
The Critical Rendering Path, or CRP, is related to chaining critical requests. It describes how a web page loads in a browser. The entire website must load before elements like CSS and JavaScript may be seen.
The Google PageSpeed Insights tool lists the request chains for the page under analysis. The list includes resource sizes in addition to several dependent requests. Before the page is viewable, these requests must be fulfilled. The best course of action is to reduce the quantity and size of requests using a variety of techniques, such as minification, delaying, removing resources that stall renders, etc.
Furthermore, you can try to reduce the CRP by streamlining the order in which page assets load. To do this, shift the information that is above the fold to the top of the HTML file. However, the Google PageSpeed Insights tool doesn’t mark a certain amount of key request chains as “pass” or “fail” in an audit. It only recommends the adjustment to assist in speeding up the loading of your website.
Appropriate SEO
For every website to function, SEO and keyword rankings are essential. It also plays a significant role in Google PageSpeed rankings. Optimizing content for Google crawlers is essential to ensure proper comprehension and indexation of online content.
Any new business must grasp the relationship between SEO and its particular industry. To stay current, they must also adhere to SEO best practices. Startups would benefit from having early access to a safe server environment using Server Gigabit.
Conclusion
A website wants to draw visitors in and keep them there for an extended period of time. A key component of every business is having strong conversion rates. But if your website loads slowly, it’s all for nothing. When a user waits for a page to display its contents, you have to maintain their attention for a little while.
The Google PageSpeed Insights tool aids in improving the functionality and speed of your website. The user can comprehend the issues causing site loads to take longer to load thanks to the speed test tool. It gives your page a score and makes it very evident to you where it sits.
Additionally, the program makes suggestions to assist you in improving page speed. Google provides a number of remedies to improve the usability and convenience of your website since it recognizes the connection between page load time and conversions.